Data Science Team Examines Equitable Access to Dock-less Bikes in Seattle
A team of researchers based at the University of Washington Information School has explored distribution patterns of dock-less bikes to assess equitable access for geographic areas and socio-demographic groups across the city of Seattle.
Professor Bill Howe, Director of the Information School’s Urbanalytics unit, is working with PhD student An Yan and Steve Mooney, Acting Assistant Professor of Epidemiology, on the project. The researchers studied statistics for three companies covering an 11-month period from October 2017 through August 2018 in which the City of Seattle permitted a pilot phase for the operation of free-floating bike share systems. During the pilot phase, there were more than 10,000 bikes available and over 450,000 trips taken. The bikes’ GPS tracking capabilities, which enable customers to locate and unlock nearby bikes through a mobile app, simultaneously leave a data trail that can be used to generate statistics on usage. Operators track information such as start and end locations, trip time and duration.
Researchers studying equitable access to bike share systems in a handful of U.S. and Canadian cities have identified differences in service along lines of race, education and income level, with greater access for advantaged groups in most cases, according to Yan’s research. While these studies primarily involved docked systems, the UW study examined Seattle’s dock-less service, which has different bike distribution processes. In a dock-less system, companies initially set out bikes across the city but individual users determine their drop-off location after each trip, with an endless array of possibilities. Those customer choices affect subsequent users’ pick-up location choices. This is followed by companies repositioning bikes via trucks and vans to high demand areas, which are often at a higher elevation, as riders frequently use the bikes to travel downhill.
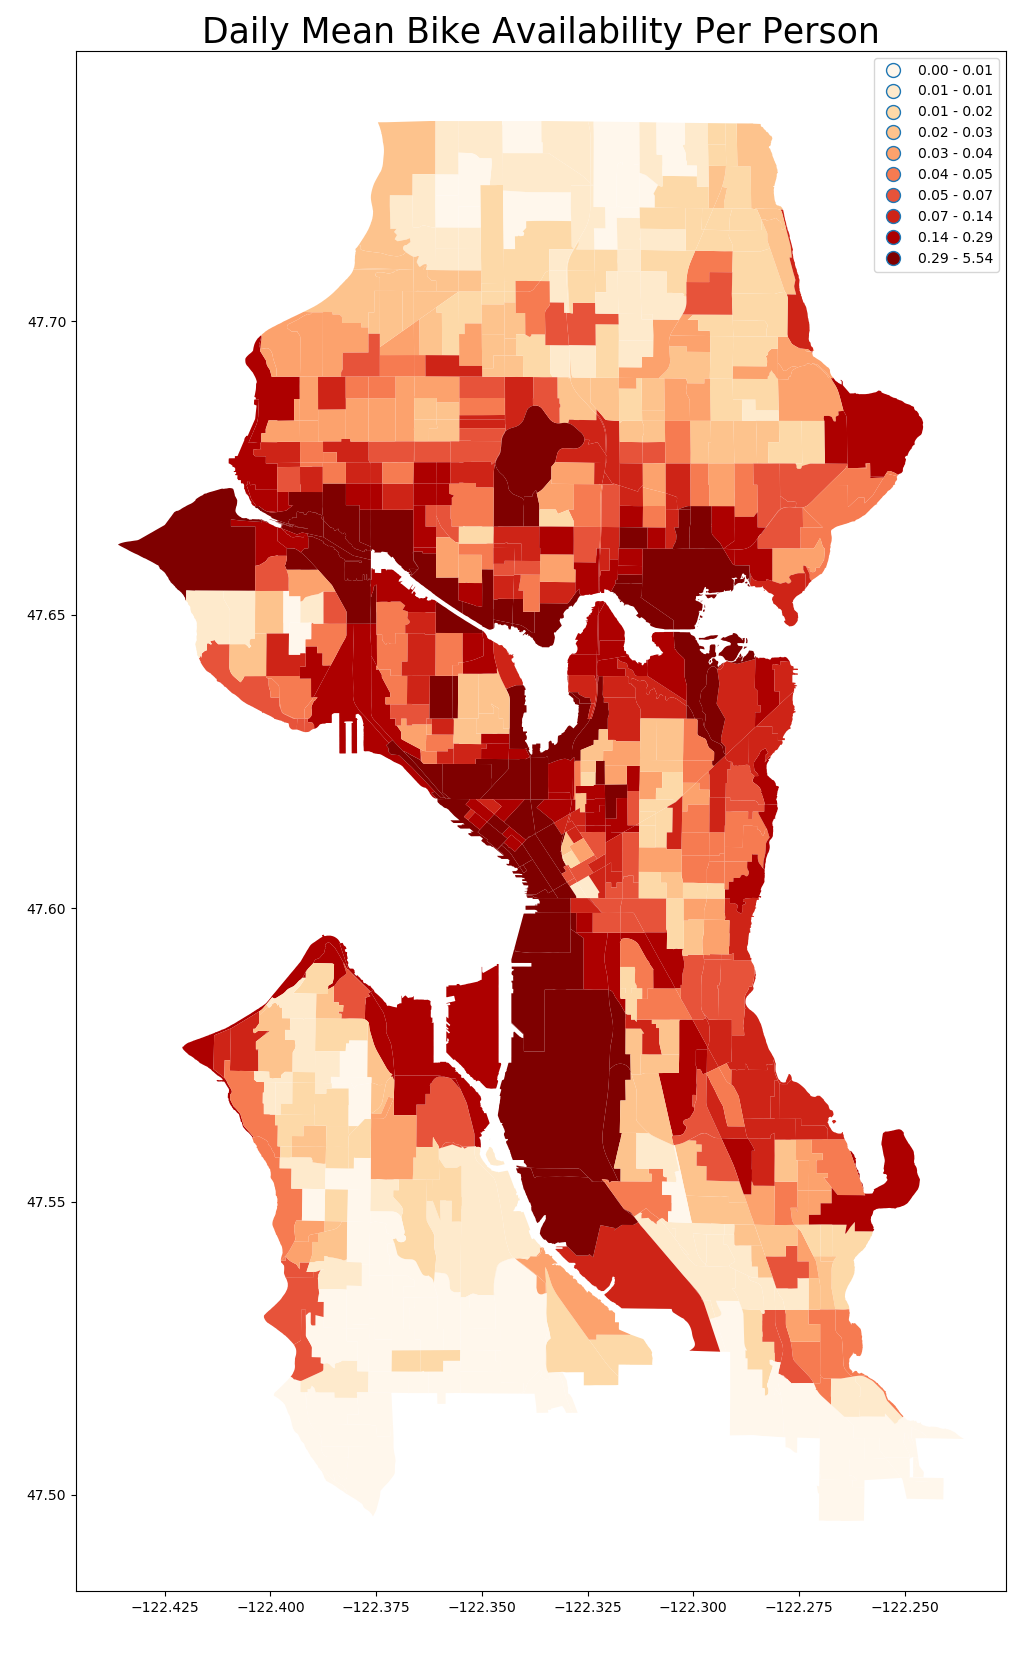
The research team set out to uncover equity issues in bike distribution, determined by both customer drop-off choices and company re-positioning strategies. To measure bike access in each Census block group, they looked at bike availability compared to block group population. Service areas were defined spatially, with bikes less than 200 meters away considered accessible to customers, and by temporal availability, or the average idle time of bikes between trips. Using this method, they mapped average daily availability per capita across the city.
The researchers combined this geographic assessment with the U.S. Census Bureau’s American Community Survey data for 2017, which provides average socio-demographic data at the block group level. Then they compared the socio-demographic data for populations inside and outside of bike share service areas to determine the accessibility of bikes to different populations. A separate comparison examined the service areas of repositioned or rebalanced bikes, identified as those with start positions differing from the end of their last trip.
Results are preliminary, with two caveats: The researchers note potential inaccuracies in their identification of bike repositioning due to noise in the data and a lack of ground truth data. In addition, they did not conduct statistical tests to verify significance in their comparisons of the means of socioeconomic variables among populations inside and outside of service areas. However, their discoveries shed light on important considerations for a prominent local service as new permit applications are under evaluation by city officials.
Research results showed lower bike access for African Americans, who make up 6.53% of the population within service areas, and 6.44% of the population in areas with repositioned bikes, compared to 8.62% across the city. By contrast, whites comprised 67.10% of the population within service areas, and 66.45% of areas with bike re-positioning, compared to 65.86% of the population across the city. A notable difference was shown between the population of households without cars in service areas (32.41%) compared to the city as a whole (16.93%), indicating higher bike access for those without cars. Households with incomes over $100,000 had less access to bikes than those with lower incomes, as the higher earning households comprised 33.01% of the population within service areas, compared with 40.45% of the city population. Access was also somewhat lower for people over 65 years of age and those with lower education levels. In most cases, repositioning bikes slightly exacerbated differences between the population served and the city population.
In addition to sociodemographic variables, bike availability was also higher in areas that are popular, close to and easily accessible to the city center, at lower elevation, and along coastlines. The highest availability was seen in the University District, Downtown, Green Lake, Industrial District and Lower Queen Anne.